
Objective
CD Spectroscopy measures differences in the absorption of left-handed polarizedlight versus right-hand polarised light which arises due to structural asymmentryof an optically active substance.
It's a powerfull tool to analyze the structure of biomolecules and their interactionwith various ligands.
Changes in the CD spectra reflect a perturbation in the structure of biomolecules brought about by changes in conditions like temperature, pH, or drug binding. Protein folding/unfolding can be followed by changes in the CD spectra.
Besides, the chirality of small molecules can be determined with the help of CD spectroscopy. Stereochemistry of products through enzymatic reactions is also an important activity of CD spectroscopy, which is related to the 3D-structure of the active site of the enzyme.
Equipment & Details
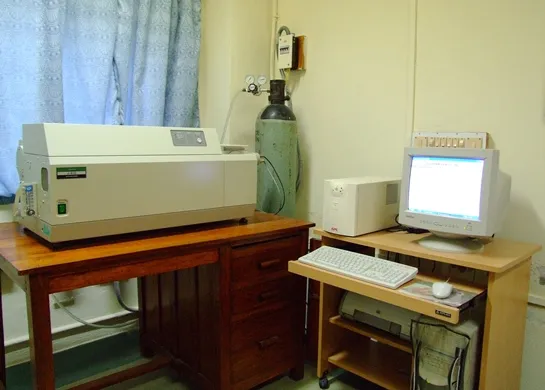
Circular Dichroism Spectropolarimeter
Model: JASCO (J-810)
Specification of the Instrument:
CD Measurements are being carried out using 150W air-cooled xenon lamp as source of light with measurement wavelength range from 163 to 900nm (standard detector).It provides a CD resolution of 0.0005 mdeg,0.01 mdeg,0.1 mdeg (at ± 10mdeg,± 200mdeg,± 2000mdeg full scale respectively). Protein secondary structure can be determined by CD spectroscopy in the far-UV spectral region (190-240nm).For estimation of protein secondary structure the reference CD spectra published in "Table III of Methods in Enzymology,130,208-269 (1986) by Prof. Jen Tsi Yang.Biochemistry/Biophysics Dept.University of California,San Francisco,USA" are used.The data contained in this table is used as a reference file.
Manufacturer details: JASCO International Company Limited(Hachioji,Tokyo, JAPAN)
Date and cost of Procurement: 16th Aug 2002; Yen 74,25,000.00 ~ Rs 30,03,190.00/-
Purchase source (funding): Institute
Year of installation: 16th Feb.2003
Sample Details
The concentration at which CD is measured is sample dependent. It is necessary to consider the proper range of OD (usually OD of ~ 1). If the OD reaches approx. 2, noises increase and the spectrum may be distorted due to luminescence, depending on the sample. Although CD is not much affected by the turbidity of the solution, a short cell should be used if the photomultiplier voltage exceeds 400 V. Small optical path length of 5 mm or less are mainly used to expand the short-wavelength limit of the far-UV region, they are also used to decrease the sample OD. The cells with a large optical path length of 2 cm or more are used when the sample concentration is smaller. However, a high tension voltage (HT) of the photomultiplier detector of 500 V or more is not recommended because noise increases with the exponential function of the OD when the HT increased. Apart from the above, sufficient amount of the buffer used for sample preparation is needed for baseline correction and rinsing the cells.

CD spectra of 10µmol/L Bovine Serum Albumin (BSA) in Distilled Water using quartz cell with 0.1cm cell path length at room temperature.
|
HELIX |
24.4 % |
|
BETA |
25.0 % |
|
TURN |
21.5 % |
|
RANDOM |
29.1 % |
Secondary Structure Estimation Report of Bovine Serum Albumin (BSA)