
Objective
Chemical characterization of polymers, organic and inorganic chemical compounds, biological samples, ceramic and semiconductor materials in transmission as well as ATR modes, diffused reflectance spectroscopy, specular reflectance spectroscopy etc.
Equipment & Details
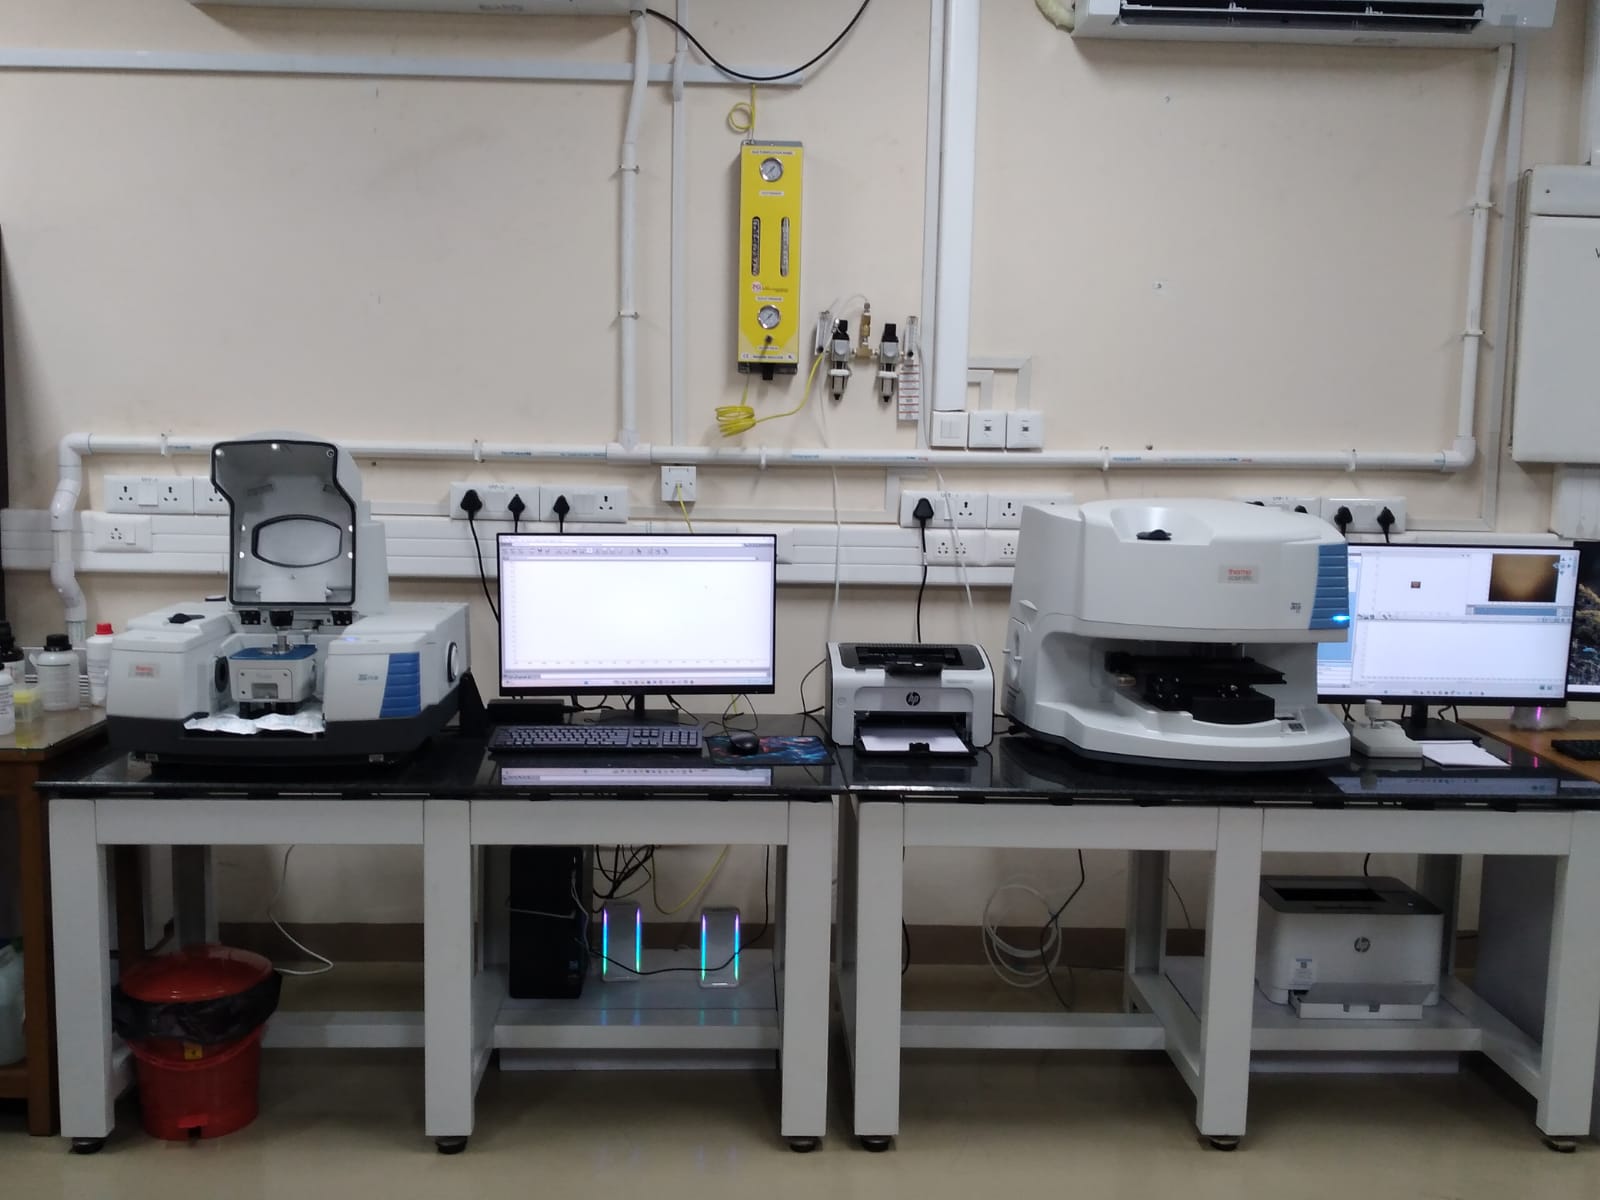
Name - Fourier Transform Infrared Spectrometer
(FT-IR Spectrometer)
Manufacturer - M/S THERMO FISHER SCIENTIFIC INSTRUMENTS,
5225 VERONA ROAD,
MADISON, WISCONSIN- 53711-4995,
USA
Model - NICOLET 6700
Date of Installation – 27.06.2013
Purchase source (funding) - Institute plan Grant
(FT-IR Spectrometer)
Manufacturer - M/S THERMO FISHER SCIENTIFIC INSTRUMENTS,
5225 VERONA ROAD,
MADISON, WISCONSIN- 53711-4995,
USA
Model - NICOLET 6700
Date of Installation – 27.06.2013
Purchase source (funding) - Institute plan Grant
Sample Details
The FT-IR analysis can be done with samples in the form of solid, liquid as well as film. Solid powder sample is intimately ground with solid KBr in mortar pestle and a thin pellet is made with a die using a hydraulic press. Such pellet can be placed in the IR beam for analysis. A very thin film sample for analysis can be directly placed in the IR beam for analysis. For analyzing liquid samples, a liquid cell is used.


Utility and Working Principle
FTIR relies on the fact that the most molecules absorb light in the infra-red region of the electromagnetic spectrum. This absorption corresponds specifically to the bonds present in the molecule. The frequency range measured as wave numbers is typically over the range 4000 – 600 cm-1. Analysis results are available in the form of a printed spectrum with Y-axis in absorbance / % transmittance and X- axis in wave numbers (cm -1). Analysis data may also be available in a CD for further processing.The background emission spectrum of the IR source is first recorded, followed by the emission spectrum of the IR source with the sample in place. The ratio of the sample spectrum to the background spectrum is directly related to the sample's absorption spectrum. The resultant absorption spectrum from the bond’s natural vibration frequencies indicates the presence of various chemical bonds and functional groups present in the sample. FTIR is particularly useful for identification of organic molecular groups and compounds due to the range of functional groups, side chains and cross-links involved, all of which will have characteristic vibrational frequencies in the infra-red range.